
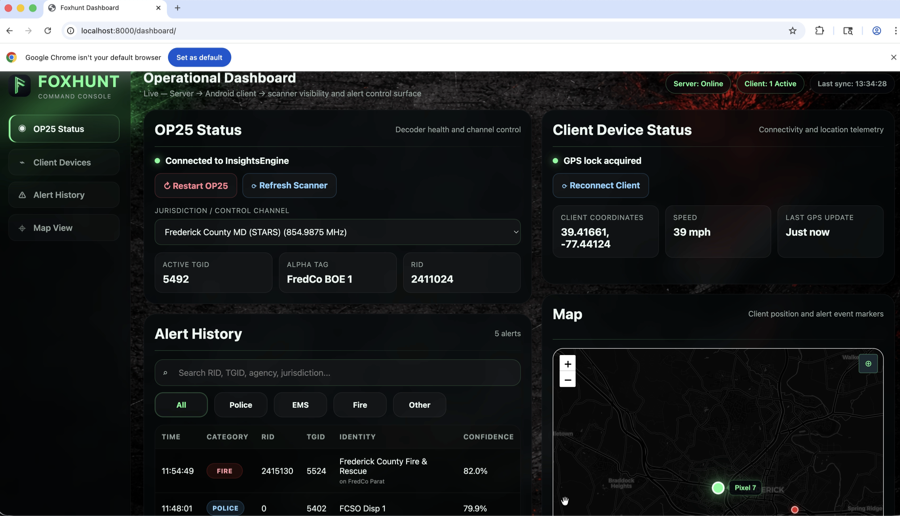
Until today the only way to watch the geolocation engine work was through the Android app or by tailing log files. That changed with the addition of a full live web dashboard served directly from the engine’s FastAPI backend. The dashboard connects via a dedicated read-only WebSocket endpoint and streams PIN_DROPs, status updates, and RF observation metrics in real time.
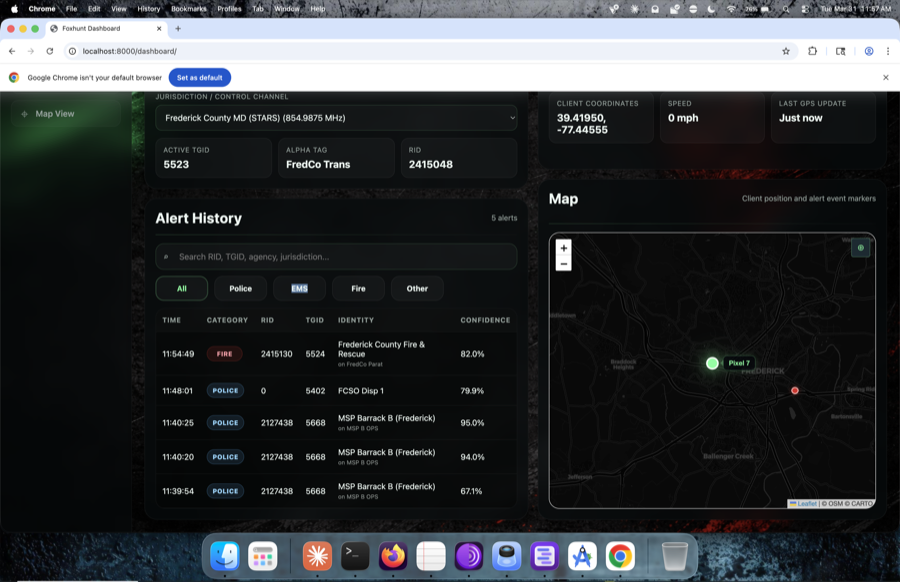
The implementation uses Leaflet with CartoDB dark tiles for the map, matching the visual language of the Android app. PIN_DROP markers appear on the map as color-coded circles (blue for police, red for EMS, amber for fire, gray for other) and auto-expire after five minutes. A live alert table below the map shows recent detections with search and category filtering, and a metrics strip across the top displays connection status, GPS age, jurisdiction, and processing statistics.
The backend changes were more involved than the frontend. A new set of dashboard-specific WebSocket clients is tracked separately from Android clients — dashboard connections don’t trigger queue flushes on disconnect, and dashboard clients receive timestamped versions of PIN_DROPs with additional server-side metadata. A REST endpoint at /api/alerts provides paginated access to a ring buffer of the last 500 detections, filterable by category. A /api/dashboard endpoint returns a full state snapshot including server status, device GPS, jurisdiction, subsystem health, and cumulative statistics.
The dashboard also serves as a field monitoring tool. During test drives, a second screen running the dashboard shows what the engine is doing without needing to touch the phone. The auto-reconnecting WebSocket client handles the inevitable network interruptions during mobile testing, and the status_update messages (every 10 seconds) provide a heartbeat that confirms the engine is alive even when no RF activity is occurring.
The entire dashboard is a single HTML file with inline CSS and JavaScript — no build step, no dependencies beyond Leaflet’s CDN. It lives at sicario-local/web/index.html and is served automatically when the engine starts, accessible at http://localhost:8000/dashboard.